Creating a Live Audio Waveform in SwiftUI
Learn how to display audio waveforms in a SwiftUI app with Swift Charts and the AVFoundation and Accelerate frameworks.

The Fast Fourier Transform, also known as FFT, is an algorithm that computes the loudness and the frequency of any sampled sound in a fast and efficient way. This computation tells exactly which musical notes - frequencies - are hidden inside a sound, by turning a long list of sound measurements - time‑domain - into a list of note strengths - frequency‑domain.
To achieve such a result, FFT relies on complex numbers and trigonometric functions that are able to reveal how much of each frequency is present in the signal.
This transformation applies the divide and conquer approach to the Discrete Fourier Transform (DFT) breaking the signal into a long list of computations, analyzing and recombining them into a sum of sine waves at varying frequencies in order to improve the performance and reduce the time from N2 steps to N log N.
Its speed makes it particularly useful when dealing with big data sets and with real‑time apps like music visualizers, medical heart‑rate monitors, and image compressors.
In this short tutorial, we will guide you on how to use the FFT to analyze sound data sets to visualize the resulting frequencies into a live audio waveform feature in a SwiftUI app.
The task will include:
- gathering of audio data in real-time;
- the use of the Fast Fourier Transform (FFT) to process that data;
- and displaying the waveform.
We will make use of Apple's AVFoundation, Accelerate, and the Swift Charts frameworks for the purpose.
In our case, the FFT will convert the microphone’s raw audio signals into their frequency components, allowing to see how strong each frequency is, which helps visualize the changing shape of sound over time.
At the conclusion of this tutorial, you will have a working SwiftUI app that visually represents a live audio waveform like follows:
Live Audio Waveform in a SwiftUI app
Before we start
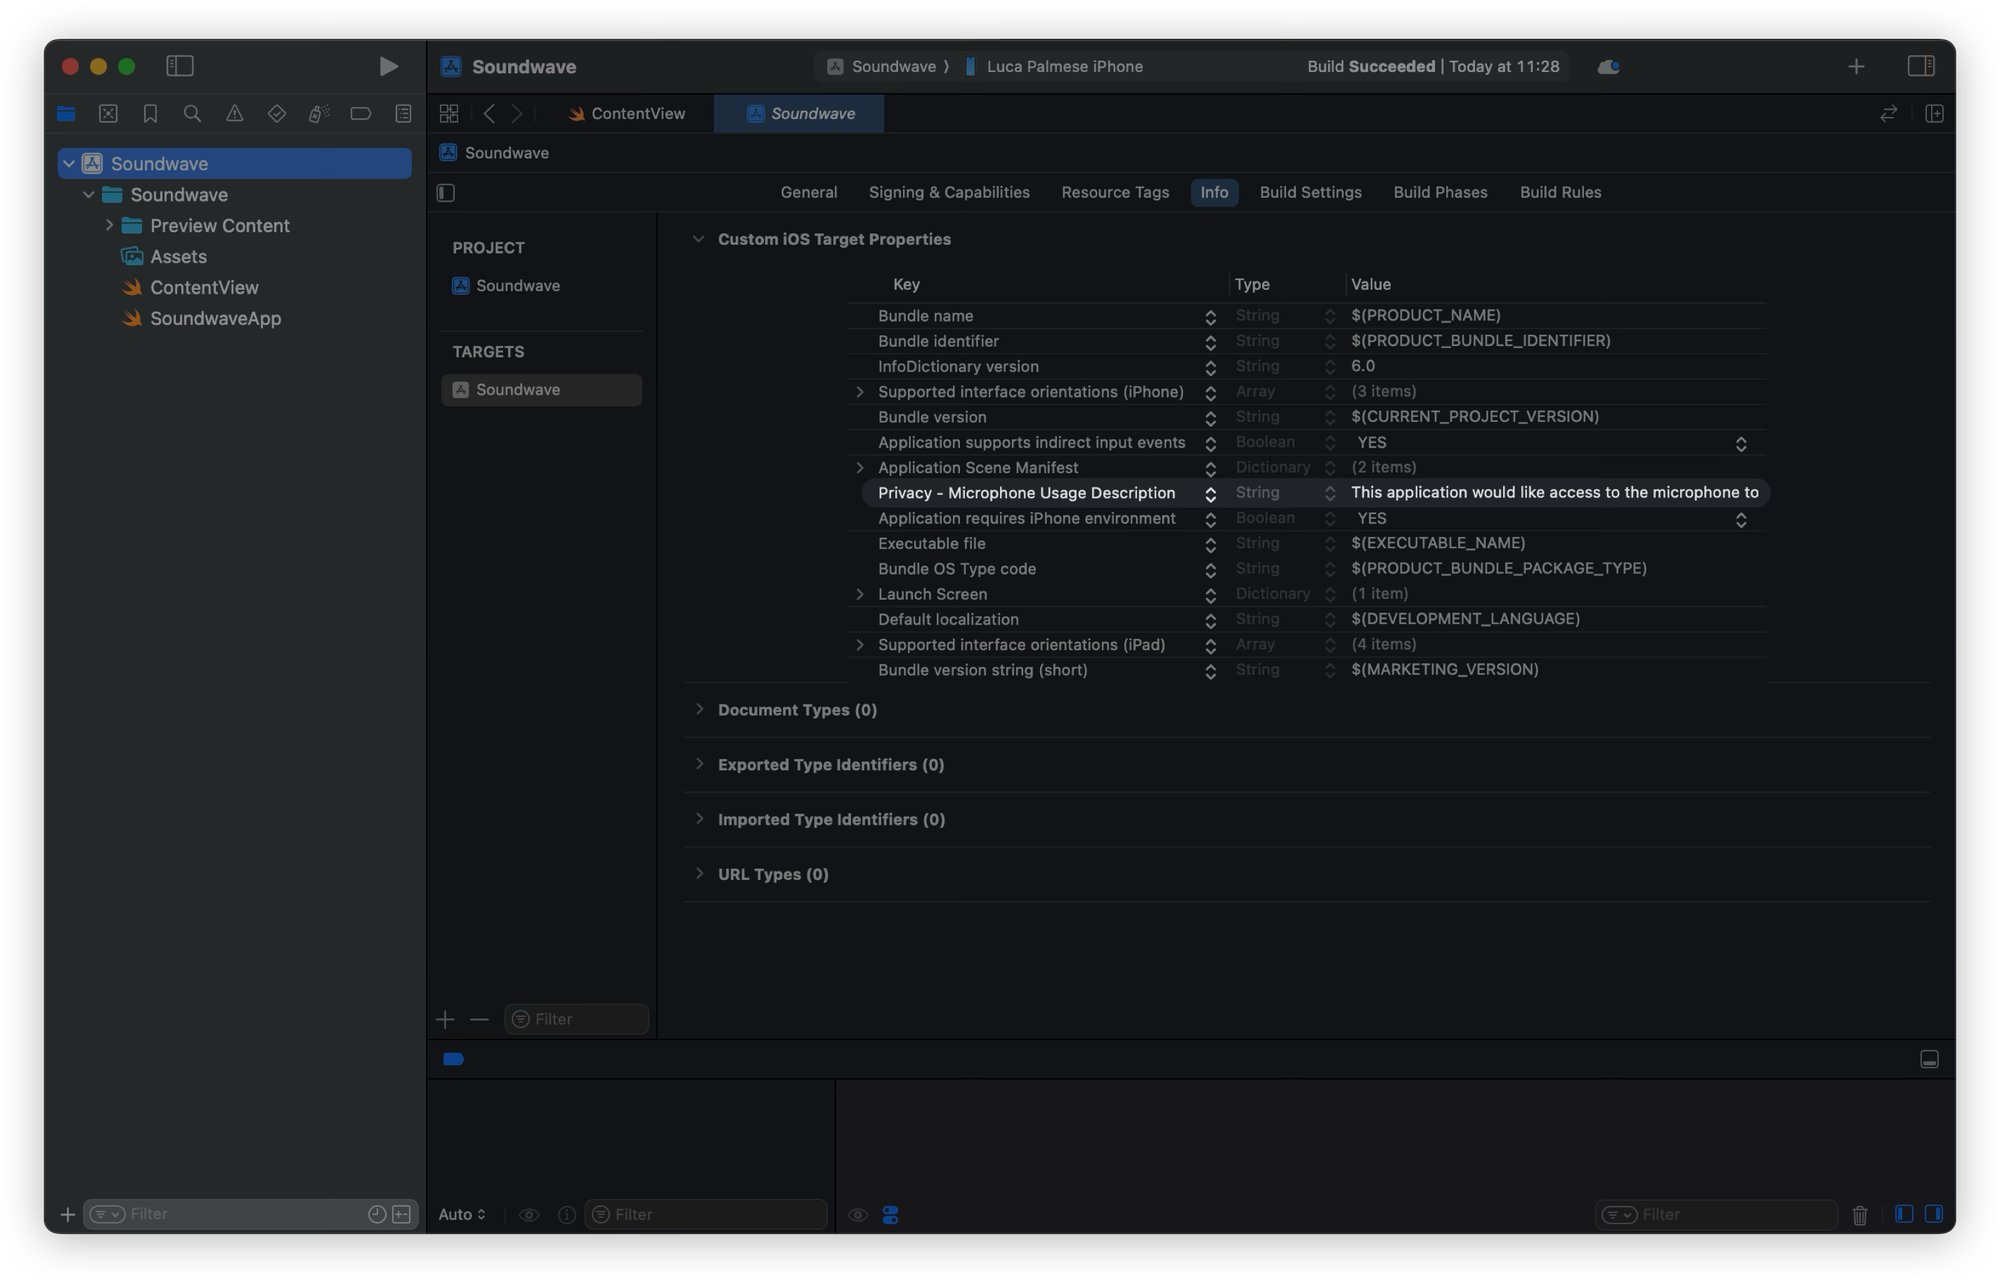
Since the live audio waveform is rendered according to the audio signal we receive through the iPhone, we have to ask users the permission to utilize the microphone. Therefore, make sure you have created a new Xcode project already and added the Privacy - Microphone Usage Description target property with its value in your project's Info.plist file to access the device's microphone in iOS.
Furthermore, if you also add the “Metal Capture Enabled” Target Property with its value set on YES, you would get rid of some log noise in the Console when you launch the app.
Adding this property lets you record what your app is allegedly doing with Metal, Apple’s graphics engine, during intensive work such as updating live audio waveforms on the interface.
This also lets you view the capture in Xcode’s GPU debugger, which shows all the rendering steps, textures, and performance data of these computations.
Step 1: Collecting the audio data
The goal of this first step is to define the class that will access, monitor and process the audio coming from the microphone in real-time using AVAudioEngine.
Later, this class will also be in charge of performing a FFT to convert audio samples into frequency magnitudes.
Here is how to do it.
1.1 Defining the configuration values
In a new AudioWaveformMonitor.swift file:
// 1. Importing the frameworks
import SwiftUI
import AVFoundation
import Accelerate
import Charts
- We start by importing the frameworks:
AVFoundationis used for capturing and managing the microphone input;Acceleratesupplies fast mathematical operations to process audio in the frequency domainSwiftUIandChartsare responsible for creating the user interface and displaying the resulting waveform visually.
// 2. Declare key configuration values
enum Constants {
    // a. Amount of frequency bins to keep after performing the FFT
    static let sampleAmount: Int = 200
    // b. Reduce the number of plotted points
    static let downsampleFactor = 8
    // c. Handle high spikes distortion in the chart
    static let magnitudeLimit: Float = 100
}
- Create a
Constantsenum that groups together key configuration values.sampleAmountdefines how many frequency bins we want to keep after performing the FFT;downsampleFactorhelps reduce the number of plotted points to avoid clutter and reduce chart overcrowding;- and
magnitudeLimitensures that unusually high spikes in the data don’t distort the scale of the chart.
If you want a more crowded chart, just decrease the value of downsampleFactor as you please.
1.2 Defining the AudioWaveformMonitor class
In the same file:
...

// 1. AudioWaveformMonitor class
@MainActor
@Observable
final class AudioWaveformMonitor {

    // 2. Shared instance of the class
    static let shared = AudioWaveformMonitor()

    // 3. Provide access to the microphone stream
    private var audioEngine = AVAudioEngine()

    // 4. Store the results
    var fftMagnitudes = [Float](repeating: 0, count: Constants.sampleAmount)

    // 5. Pick a subset of fftMagnitudes at regular intervals according to the downsampleFacto
    var downsampledMagnitudes: [Float] {
        fftMagnitudes.lazy.enumerated().compactMap { index, value in
            index.isMultiple(of: Constants.downsampleFactor) ? value : nil
        }
    }
}
- Define the
AudioWaveformMonitorclass that- handles real-time audio input;
- is the responsible for converting it from time-based samples into frequency-based magnitudes using a function that performs a Fast Fourier Transform (FFT).
- Create a shared instance of
AudioWaveformMonitor - Declare an instance of
AVAudioEngineneeded to provide access to the microphone stream AVAudioEngineresults are stored in thefftMagnitudesarray.- To keep the visualization clean, the computed variable
downsampledMagnitudesjust picks a subset of its values at regular intervals according to thedownsampleFactorthat we defined in the constants.
1.3 Defining the start and stop methods
Now, we need to define methods to start and stop monitoring the audio coming from the microphone.
final class AudioWaveformMonitor {

    ...

    // 1. Track if audio monitoring is running or has stopped
    var isMonitoring = false

    private init() {}

    // The methods to be implemented
    func startMonitoring() async { ... }

    func stopMonitoring() { ... }

    func performFFT(data: [Float]) async -> [Float] { ... }

}
- Add a
isMonitoringproperty to track if audio monitoring is running or has stopped, which is useful for coordinating the User Interface state.
Finally, we define three different methods as follows:
startMonitoring()taps into the microphone and processes the incoming data asynchronously;stopMonitoring()shuts everything down and resets the data;performFFT()is the asynchronous function that actually performs the FFT transformation, responsible for extracting the strength of different frequencies from the raw waveform given by the microphone.
Step 2: Start Monitoring, Stop Monitoring and Performing the FFT
Let’s get deep into defining the bodies of the three functions: startMonitoring(), stopMonitoring(), and performFFT().
2.1 Starting Audio Waveform Monitoring Asynchronously
First thing first, we need to define the startMonitoring() function that:
- starts the audio monitoring,
- processes the sounds captured by the microphone,
- and converts them into frequency magnitudes that the interface will show.
We shaped the code so that all will stay safe under Swift 6’s stricter concurrency model.
First, let’s define some properties that will be needed to perform the FFT.
final class AudioWaveformMonitor {

    ...

    // 1. The configuration parameter for the FFT
    private let bufferSize = 8192
    // 2. The FFT configuration
    private var fftSetup: OpaquePointer?

    ...
}- Define the
bufferSizeon which the FFT configuration will be set. - Create a
fftSetupproperty of typeOpaquePointer?that will point to the configuration itself used by Accelerate.
Then, in the startMonitoring() method:
func startMonitoring() async {
    // 1. Set up the input node from the audio engine
    let inputNode = audioEngine.inputNode
    // 2. Set up the input format from the audio engine
    let inputFormat = inputNode.inputFormat(forBus: 0)

    // 3. Set the FFT configuration
    fftSetup = vDSP_DFT_zop_CreateSetup(nil, UInt(self.bufferSize), .FORWARD)


}
- Create an
inputNodeproperty and set on theinputNodefrom the audio engine. - Create another property,
inputFormatand set on theinputFormatfrom the audio engine. - Set the FFT configuration with
vDSP_DFT_zop_CreateSetup, preparing Accelerate for frequency-domain calculations.
func startMonitoring() async {

    ...

    // Listen to microphone input
    let audioStream = AsyncStream<[Float]> { continuation in
        inputNode.installTap(onBus: 0, bufferSize: UInt32(bufferSize), format: inputFormat) { @Sendable buffer, _ in
            // 1. Access the first audio channel
            let channelData = buffer.floatChannelData?[0]
            let frameCount = Int(buffer.frameLength)

            // 2. Convert it into a Float array
            let floatData = Array(UnsafeBufferPointer(start: channelData, count: frameCount))

            // 3. Yield into the stream
            continuation.yield(floatData)
        }
    }


}
Next, we create an AsyncStream that listens to microphone input using installTap(onBus:). Inside the tap:
- Access the first audio channel
buffer.floatChannelData?[0]; - Convert it into a
Floatarray usingUnsafeBufferPointer; yieldthat array into the stream.
The audioStream instance bridges callback-based audio input into Swift 6’s more structured concurrency: marking the closure @Sendableensures it’s thread-safe and complies with the most up to date stricter concurrency rules.
Furthermore, since AudioWaveformMonitor is marked @MainActor, all property updates, including changes to fftMagnitudes, happen safely on the main thread, keeping the interface built with SwiftUI in sync.
func startMonitoring() async {

    ...

    do {
        // 1. Start the audioEngine
        try audioEngine.start()
        // 2. Update the property to monitor the state of the audioEngine
        isMonitoring = true
    } catch {
        print("Error starting audio engine: \(error.localizedDescription)")
        return
    }

    // 3. Retrieving the data from the audioStream
    for await floatData in audioStream {
        // 4. For each buffer, compute the FFT and store the results
        self.fftMagnitudes = await self.performFFT(data: floatData)
    }
}
Before processing the stream:
- we start the audio engine,
- and set
isMonitoringontrueto reflect the active state. - Finally, we enter a
for awaitloop (running on the main actor) to retrieve the float data. - For each buffer, we call the async function named
performFFT(_:)to compute the FFT off the main thread to avoid slowing down the interface, then await and store the results infftMagnitudes.
2.2 Stopping Audio Waveform Monitoring:
Now, let’s define the stopMonitoring() function to stop the audio monitoring.
func stopMonitoring() {
    // 1. Stop the audioEngine
    audioEngine.stop()

    // 2. Remove the tap from the microphone input
    audioEngine.inputNode.removeTap(onBus: 0)

    // 3. Reset the fftMagnitudes array to all zeros, to clear the visualization
    fftMagnitudes = [Float](repeating: 0, count: Constants.sampleAmount)

    // 4. Release the FFT setup free system memory
    if let setup = fftSetup {
        vDSP_DFT_DestroySetup(setup)
        fftSetup = nil
    }

    // 5. Update the audioEngine state property
    isMonitoring = false
}
This function halts audio monitoring by:
- Stopping the audio engine;
- Removing the tap from the microphone input;
- Then, it resets the
fftMagnitudesarray to all zeros, ensuring the visualization clears out cleanly; - Additionally, it releases the FFT setup (
fftSetup) used for frequency-domain calculations viavDSP_DFT_DestroySetup, helping free memory and system resources; - Finally, it sets
isMonitoringonfalseto reflect that monitoring has fully stopped.
2.3 Performing the Fast Fourier Transform Asynchronously
The most crucial function is performFFT().
It is responsible for asynchronously making the magic happen: it takes in an array of floating-point numbers (data) representing audio samples taken from the microphone, and performs a Fast Fourier Transform (FFT) using Apple's Accelerate framework.
Although the code calls functions that compute the Discrete Fourier Transform (DFT), it uses highly optimized routines that implement the Fast Fourier Transform (FFT) algorithm.
In essence, the FFT is an efficient way to calculate the DFT, and Apple's Accelerate framework provides this fast, optimized version. So we often refer to it as the FFT even though we're technically computing the DFT.
func performFFT(data: [Float]) async -> [Float] {
    // Check the configuration
    guard let setup = fftSetup else {
        return [Float](repeating: 0, count: Constants.sampleAmount)
    }

    // 1. Copy of the audio samples as float
    var realIn = data
    // 2. The imaginary part
    var imagIn = [Float](repeating: 0, count: bufferSize)

    // 3. The transformed values of the real data
    var realOut = [Float](repeating: 0, count: bufferSize)
    // The transformed values of the imaginary data
    var imagOut = [Float](repeating: 0, count: bufferSize)
}
Once this asynchronous function performs the Fast Fourier Transform (FFT) on the incoming audio data, it gets its frequency content and returns an array of magnitudes ready for showing a waveform.
We start by checking whether the FFT setup exists. If not, we return an array of zeros of length Constants.sampleAmount. Assuming the setup is valid, we initialize the following arrays:
realInholds the real part of the the audio input signal (data);imagInis the imaginary part and is set to zero (since the input is real-valued);- And
realOutandimagOutwill store the transformed values after applying FFT.
func performFFT(data: [Float]) async -> [Float] {
    ...
    // Property storing computed magnitudes
    var magnitudes = [Float](repeating: 0, count: Constants.sampleAmount)

    // 1. Nested loops to safely access all data
    realIn.withUnsafeMutableBufferPointer { realInPtr in
        imagIn.withUnsafeMutableBufferPointer { imagInPtr in
            realOut.withUnsafeMutableBufferPointer { realOutPtr in
                imagOut.withUnsafeMutableBufferPointer { imagOutPtr in
		                // 2. Execute the Discrete Fourier Transform (DFT)
                    vDSP_DFT_Execute(setup, realInPtr.baseAddress!, imagInPtr.baseAddress!, realOutPtr.baseAddress!, imagOutPtr.baseAddress!)


                    // 3. Hold the DFT output
                    var complex = DSPSplitComplex(realp: realOutPtr.baseAddress!, imagp: imagOutPtr.baseAddress!)
                    // 4. Compute and save the magnitude of each frequency component
                    vDSP_zvabs(&complex, 1, &magnitudes, 1, UInt(Constants.sampleAmount))

                }
            }
        }
    }

    return magnitudes.map { min($0, Constants.magnitudeLimit) }
}
- Using Apple's
Accelerateframework, we provide direct pointers (baseAddress!) to each array to let the framework interact with the data and, through a sequence of nested closures (withUnsafeMutableBufferPointer), we ensure safe memory access. - At this point, the function executes the Discrete Fourier Transform (DFT) via
vDSP_DFT_Execute, breaking and turning the signal into its frequency components, and storing results inrealOutandimagOut. - Then,
DSPSplitComplexis a structure that holds the DFT output as separate real and imaginary parts. - It is used by
vDSP_zvabsto compute the magnitude of each frequency component using the Euclidean norm:
The result is then stored in a Float array called magnitudes.
func performFFT(data: [Float]) async -> [Float] {
    ...
    // The returing values
    return magnitudes.map { min($0, Constants.magnitudeLimit) }
}
Although the raw audio buffer contains thousands of samples (8192 in our case), we only keep 200 (Constants.sampleAmount) to ensure smooth, efficient chart rendering.
Finally, we return results that are mapped to limit their maximum value to Constants.magnitudeLimit. This clipping ensures that abnormally loud or noisy frequencies don’t distort the visual representation.
These magnitudes represent how strong each frequency is in the audio signal, key for visualizing the live audio waveforms.
Step 3: Creating the User Interface with SwiftUI
Last but not least, we create the interface to display the live waveform based on the real-time FFT data in our app. We will use Swift Charts to visualize the magnitudes as a line graph.
struct ContentView: View {

    // 1. AudioWaveformMonitor shared instance
    private var monitor = AudioWaveformMonitor.shared
    // Gradients for the chart
    private let chartGradient = LinearGradient(
        gradient: Gradient(colors: [.blue, .purple, .red]),
        startPoint: .leading,
        endPoint: .trailing
    )

    var body: some View {
        VStack(spacing: 20) {
		        // Title
            Text("Live Audio Waveform")
                .font(.title2.bold())
                .padding(.top, 20)

            Spacer()

            // 2. The button to start and stop the monitoring based on AudioWaveformMonitor.isMonitoring property
            Button(action: {
                if monitor.isMonitoring {
                    monitor.stopMonitoring()
                } else {
                    Task { await monitor.startMonitoring() }
                }
            }) {
                Label(monitor.isMonitoring ? "Stop" : "Start", systemImage: monitor.isMonitoring ? "stop.fill" : "waveform")
                    .font(.title2.bold())
                    .frame(maxWidth: .infinity)
                    .padding()
                    .background(monitor.isMonitoring ? Color.red : Color.blue)
                    .foregroundStyle(.white)
                    .clipShape(RoundedRectangle(cornerRadius: 12))
                    .padding(.horizontal)
            }
        }
        .padding(.bottom, 20)
        .padding()
    }
}
Create a view having:
- a
AudioWaveformMonitorshared instance; - a button to start and stop the monitoring based on
AudioWaveformMonitor.isMonitoringproperty that lets the user start and stop the audio monitoring, switching its label and color between “Start” and “Stop” based on the monitoring state.
Now, import Charts framework and add the following in between the title and the Spacer:
struct ContentView: View {
		...

    var body: some View {
        VStack(spacing: 20) {
		        ...

            // 1. Chart
            Chart(monitor.downsampledMagnitudes.indices, id: \\ .self) { index in
		            // 2. The LineMark
                LineMark(
		                // a. frequency bins adjusted by Constants.downsampleFactor to spread points apart
                    x: .value("Frequency", index * Constants.downsampleFactor),

                    // b. the magnitude (intensity) of each frequency
                    y: .value("Magnitude", monitor.downsampledMagnitudes[index])
                )

                // 3. Smoothing the curves
                .interpolationMethod(.catmullRom)

                // The line style
                .lineStyle(StrokeStyle(lineWidth: 3))
                // The color
                .foregroundStyle(chartGradient)
            }
            .chartYScale(domain: 0...max(monitor.fftMagnitudes.max() ?? 0, Constants.magnitudeLimit))
            .chartXAxis(.hidden)
            .chartYAxis(.hidden)
            .frame(height: 300)
            .padding()

            // 3. Smoothing the curves
            .animation(.easeOut, value: monitor.downsampledMagnitudes)

            ...
}
- Add a
Chartthat visualizes the live audio waveform by plotting the downsampled FFT magnitudes in a line chart format. - Use the
LineMark:- The x-axis represents frequency bins adjusted by
Constants.downsampleFactorto spread points apart; - while the y-axis shows the magnitude (intensity) of each frequency but is clamped to
Constants.magnitudeLimitto avoid excessive peaks.
- The x-axis represents frequency bins adjusted by
- For smoothing the curves we use
.interpolationMethod(.catmullRom)and an implicit animation.animation(.easeOut, value: monitor.downsampledMagnitudes)that updates the chart whenever the downsampled magnitudes get updated.
A curiosity about why we chose the .easeOut animation lays within the fact that it is not too heavy to be processed. Indeed, if you try to use the .smooth animation instead, the CPU starts hogging due to the amount of information to display in the interface, causing the CPU to throttle and the animation to periodically lag.
Final Result
We have now developed a basic app that can obtain real-time audio from the microphone, analyze it with FFT, and display the frequency magnitudes as a dynamic waveform through SwiftUI and Swift Charts. This setup is an excellent foundation for creating more advanced audio processing applications.
Feel free to expand on this by adding features like sound recognition, audio filtering, recording, or more complex visualizations to suit your project needs!
Indeed, we have just drawn the audio waveform by using LineMark from Swift Chart. But if you look for other ways to render it, there are infinite modes of visualization that can, of course, apply.
Different rendering (AreaMark, Custom, and BarMark) of a Live Audio Waveform in a SwiftUI app
We chose not to go too deep into how FFT calculations work in Swift, but if you want to take a deeper look, check Apple’s official Developer documentation:
In the end, if you’re curious about how it works in case you also want to integrate sound detection on live audio buffers, here is another tutorial you can take a look at: