
Debug for visionOS using Xcode simulator visualizations
Explore the visionOS simulator's debug modes in Xcode for spatial computing apps.

Let's explore the debugging modes within the visionOS simulator in Xcode, tailored for developers working on spatial computing applications. Understanding these modes is crucial for effectively visualizing and troubleshooting applications in the unique environment that Vision Pro offers.
Accessing the Debug Visualizations menu
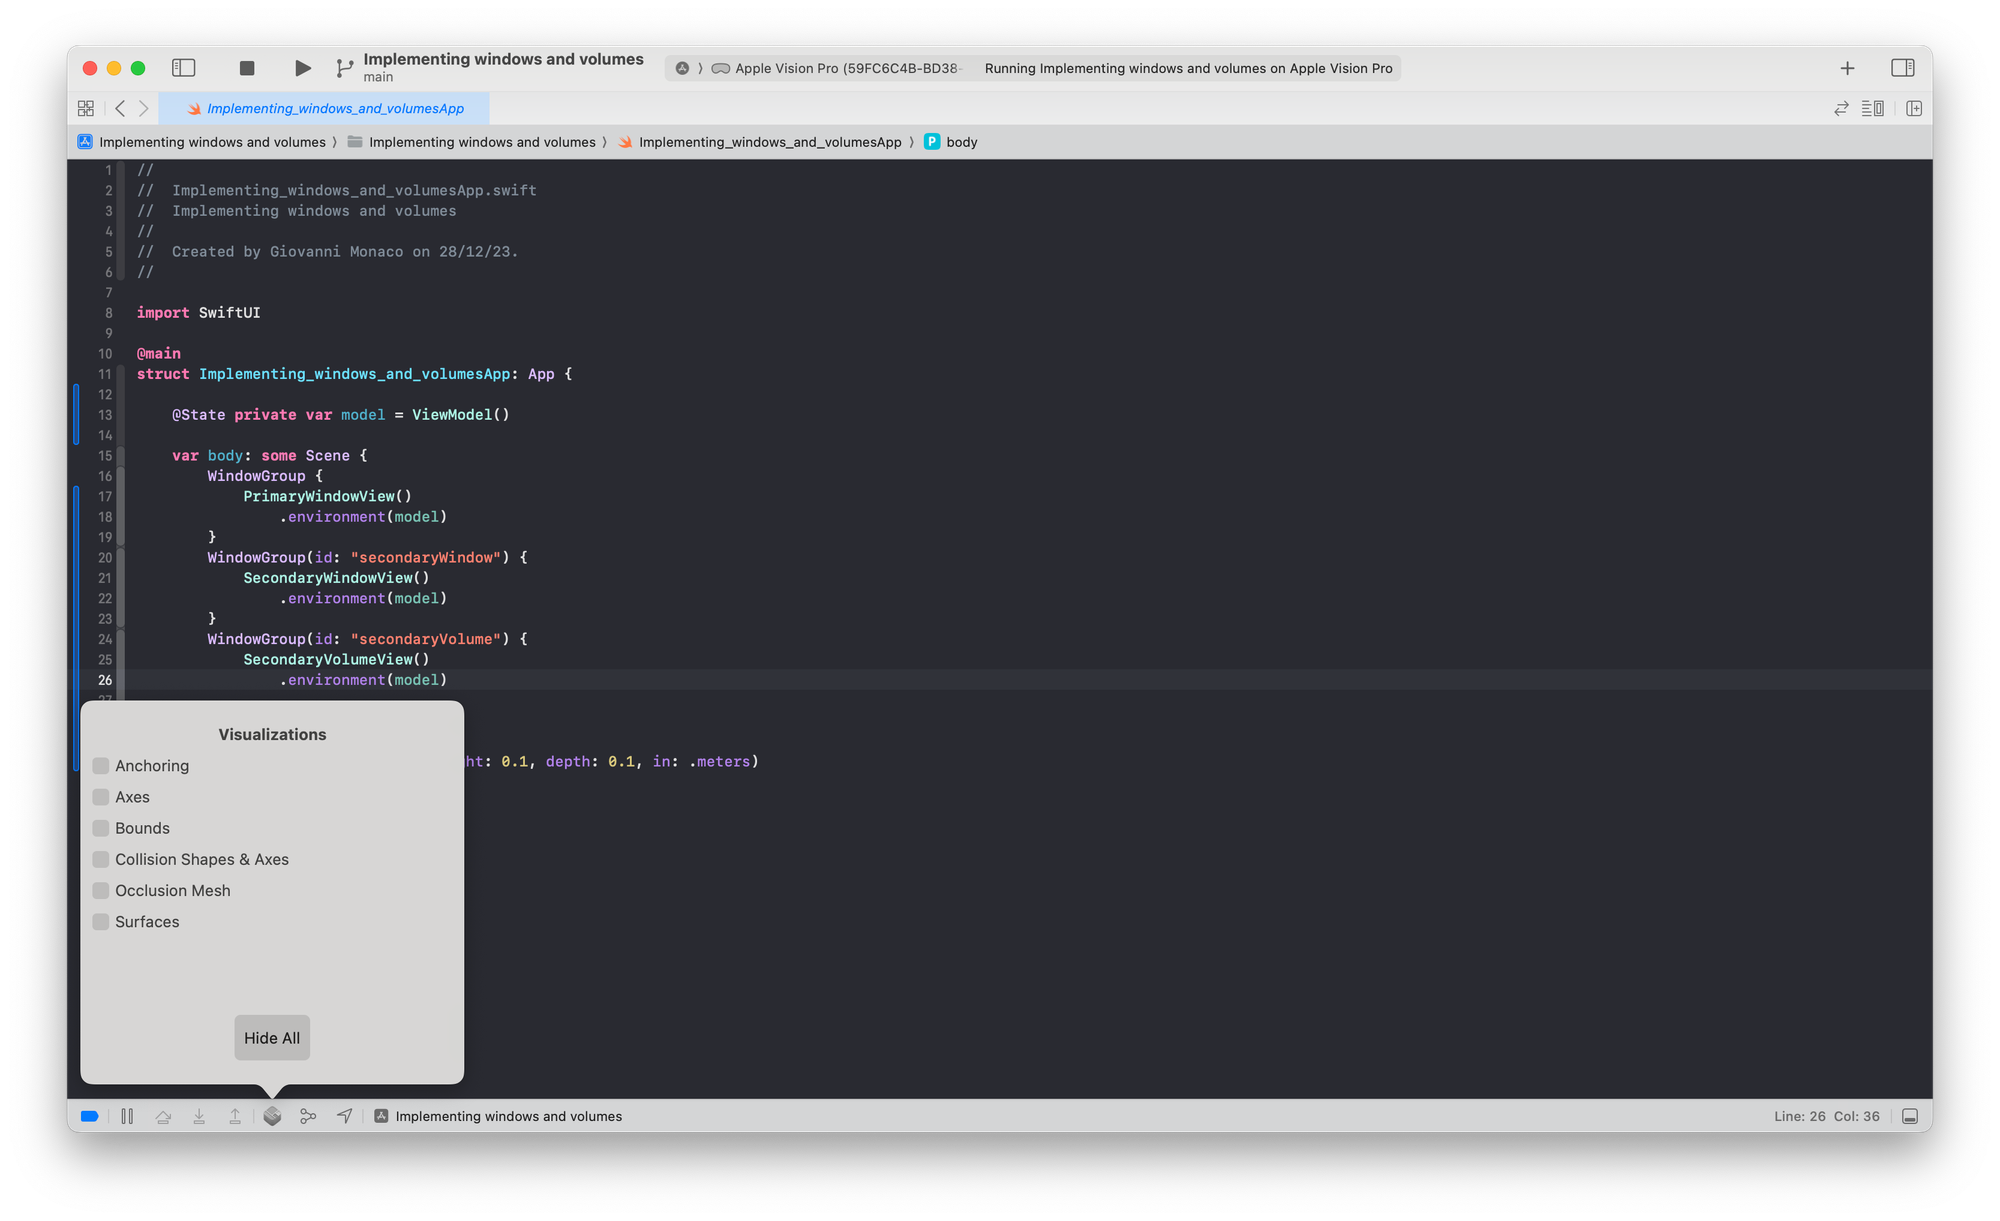
To enable the debug visualizations, you must first launch your application within the visionOS simulator. After the simulation is active, the toolbar at the bottom will display various new debugging options. Among these, the Debug Visualizations option will open a pop-up menu, allowing you to enable the debug visualization you prefer.
Exploring all debug visualizations
These are the different types of visualization you can enable:
- Anchoring
- Axes
- Bounds
- Collision Shapes & Axes
- Occlusion Mesh
- Surfaces
You can employ simultaneous mode activation in the visionOS simulator for a more dynamic and comprehensive debugging experience. By activating multiple modes at once, developers gain a layered view of the spatial environment, allowing for a multifaceted analysis and more efficient troubleshooting of applications in spatial computing contexts.
Let’s dive into the specifics of each debugging visualization offered in the visionOS simulator, understand how each one functions, and their practical applications in spatial computing development.
Anchoring Mode
Visualizes anchor points in the environment, aiding in the placement of entities. Axes are represented by colored arrows and anchors by lines.
Axes Mode
Helps understand the orientation of each object in the spatial canvas, through colored arrows indicating the x, y, and z axes.
Bounds Mode
Green lines outline the boundaries of entities, crucial for spatial awareness and entity placement.
Collision Shapes Mode
A white outline highlights the collision shape of an entity, important for interactive and responsive design in spatial computing. Use this to understand issues in event detection.

Occlusion Mesh Mode
A multi-colored wireframe overlay that indicates how real objects interact with virtual ones, ensuring a seamless blend of digital and physical elements. Use this to identify areas where virtual objects are correctly or incorrectly hidden behind real objects.
Surfaces Mode
White border lines and diagonal markings highlighting detected surfaces, aiding in accurate entity placement within the spatial environment.
Other Resources
- Running your app in Simulator or on a device | Apple Developer Documentation: a general overview of how to launch your app in a simulated device.
- Interacting with your app in the visionOS simulator | Apple Developer Documentation: to know more about how to use your Mac to navigate spaces and control interactions with your visionOS apps in the Simulator.
Mastering these debugging modes in the visionOS simulator is a step towards creating more engaging and interactive spatial computing applications, harnessing the full potential of devices like the Apple Vision Pro.